
Historically, sharp downturns in the KOSPI have served as a leading indicator for Wall Street, with US markets frequently following South Korea into a bear market after an 8 to 12-month lag.
Read Time: 6 Minutes
Pixabay: helloabt_com
Key Points
The KOSPI Index, South Korea’s benchmark stock market gauge, exhibits a fascinating and often overlooked predictive correlation with major US indices.
When global consumer demand begins to soften, it shows up first in Korean export books and the KOSPI. This makes the index a highly sensitive "canary in the coal mine" for corporate earnings, flashing a warning signal months before the slowdown finally registers in the broader consumer-centric US economy.
With retail cash levels at historic lows and margin debt high, holding cash or short-term Treasury bills yielding 5% is a tactical advantage. Having cash on hand ensures you can buy high-quality companies at deep discounts if a forced margin liquidation cascade hits the US market.
Overview
The KOSPI Index, South Korea’s benchmark stock market gauge, exhibits a fascinating and often overlooked predictive correlation with major US indices. Historically, sharp downturns in the KOSPI have served as a leading indicator for Wall Street, with US markets frequently following South Korea into a bear market after an 8 to 12-month lag.
A deep dive into macroeconomic history reveals how this pattern has repeated across major market cycles, mirroring technical setups we are beginning to observe today.
The Dot-Com Bubble (2000)
In January 2000, the KOSPI Index experienced a severe, rapid correction, plummeting 40% in just four months. While the Korean market temporarily rebounded before capitulating into a deeper crash, US equities continued to trade with relative resilience.
However, precisely eight months after the initial Korean peak, the lag caught up with Wall Street. In September 2000, the Nasdaq Composite began its historic unwinding, ultimately shedding more than 50% of its value and marking the structural collapse of the Dot-Com bubble.
The Great Financial Crisis (2007–2008)
The 2008 global financial meltdown presented a variation of this correlation. Instead of a prolonged lag, the sheer systemic shock of the subprime mortgage crisis caused an accelerated synchronization. During this period, macro liquidity evaporated globally, forcing both the KOSPI and US indices to top out and crash almost simultaneously, demonstrating that extreme systemic risks can compress the standard multi-month leading timeline.
The Post-Pandemic Tightening Cycle (2021–2022)
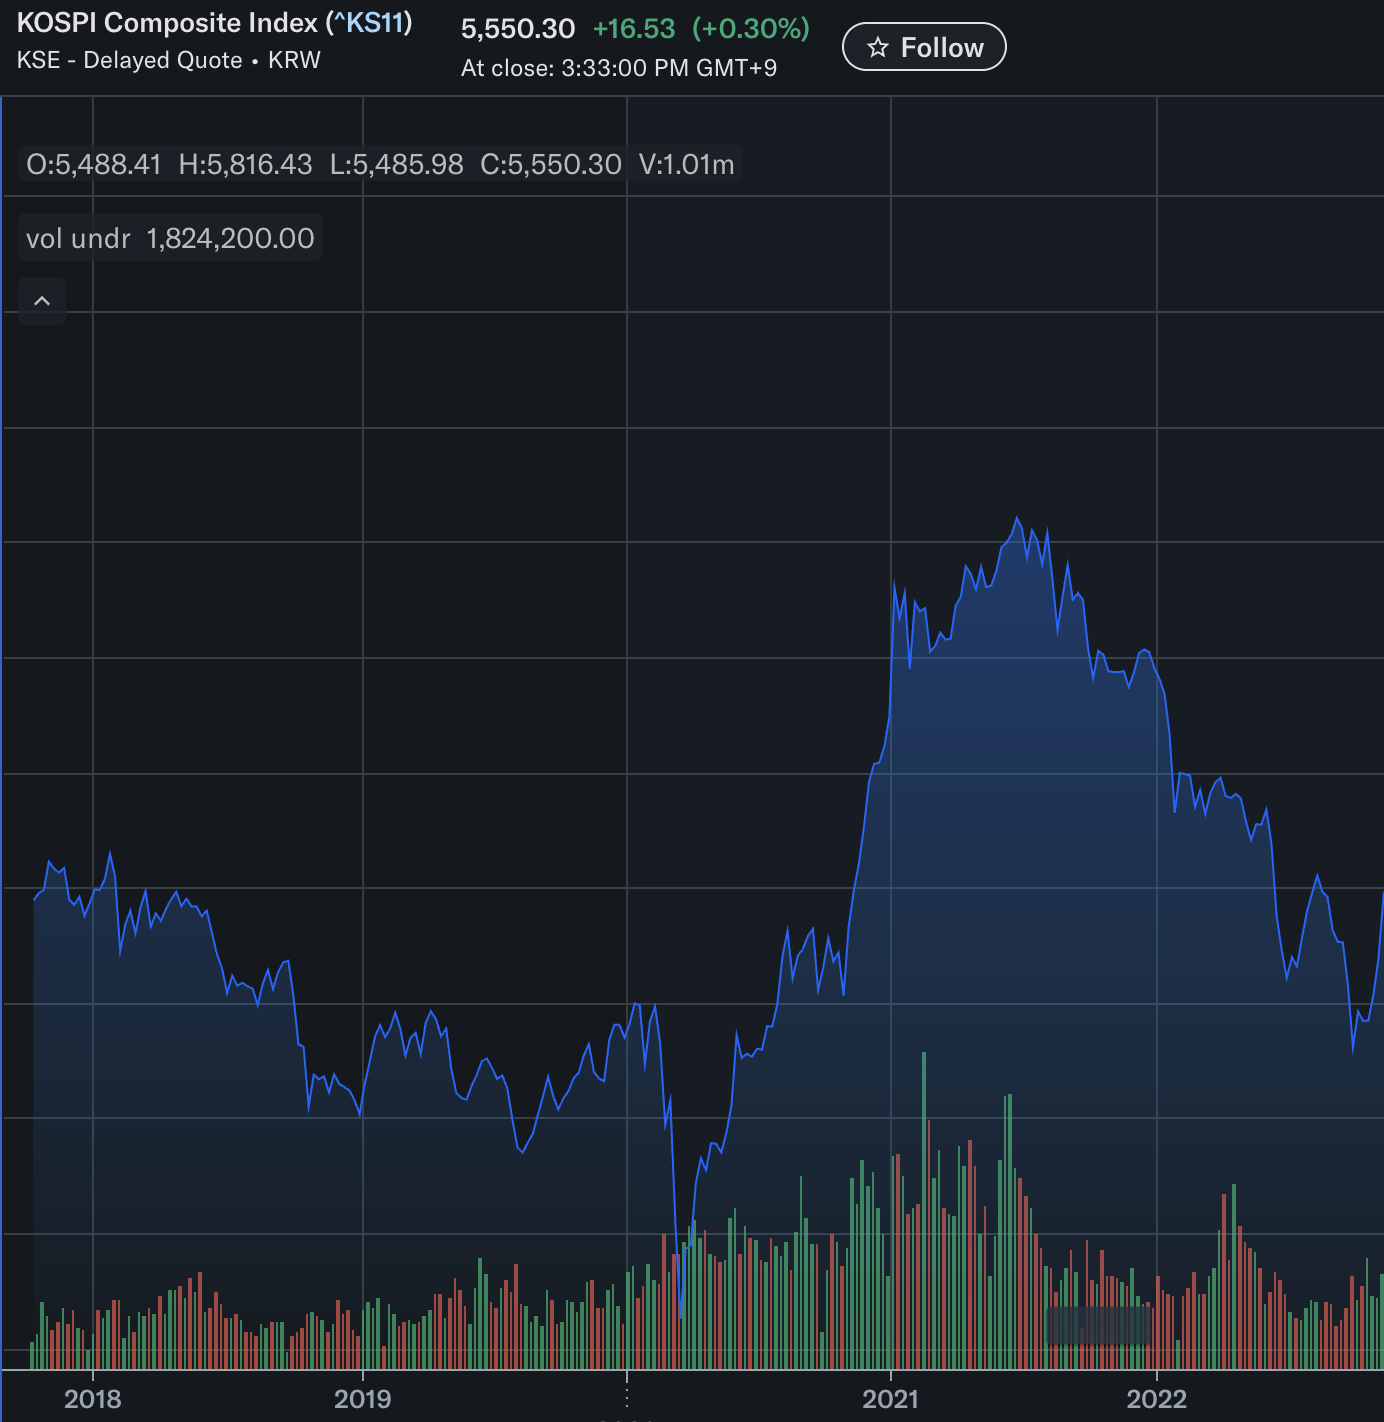
The exact historical 8-month sequence returned with striking precision during the post-pandemic tightening cycle. The KOSPI Index printed its cyclical peak in June 2021 and began a steady descent. In the meantime, the S&P 500 decoupled, continuing its march upward to new all-time highs as domestic optimism remained decoupled from global shifts.
True to historical form, exactly eight months later, in February 2022, the S&P 500 succumbed to mounting macroeconomic pressures. The index entered a severe corrective phase, dropping 28% over the next nine months.
The Broader Economic Context
This repeating phenomenon is not merely a coincidence of charting; it is deeply rooted in global trade dynamics. As a hyper-export-driven economy, South Korea sits at the absolute vanguard of the global supply chain, particularly in technology, semiconductors, and heavy industrial goods.
When global consumer demand begins to soften, it shows up first in Korean export books and the KOSPI. This makes the index a highly sensitive "canary in the coal mine" for corporate earnings, flashing a warning signal months before the slowdown finally registers in the broader consumer-centric US economy.
This data is from two different decades and two very different economic environments but it followed the same exact pattern. KOSPI has given a leading indicator of what is to come for the US markets.
Recently the Kospi Index and again under a huge pressure since June of 2026 is down 43% at the time of writing. If we keep the same timeframe as earlier historical data February marks the time when things can go south for the US markets.
Now lets try to understand why this strange relationship exists between the Korean and US market in all three instances the common theme was leverage being excessively used.
Effects of Margin
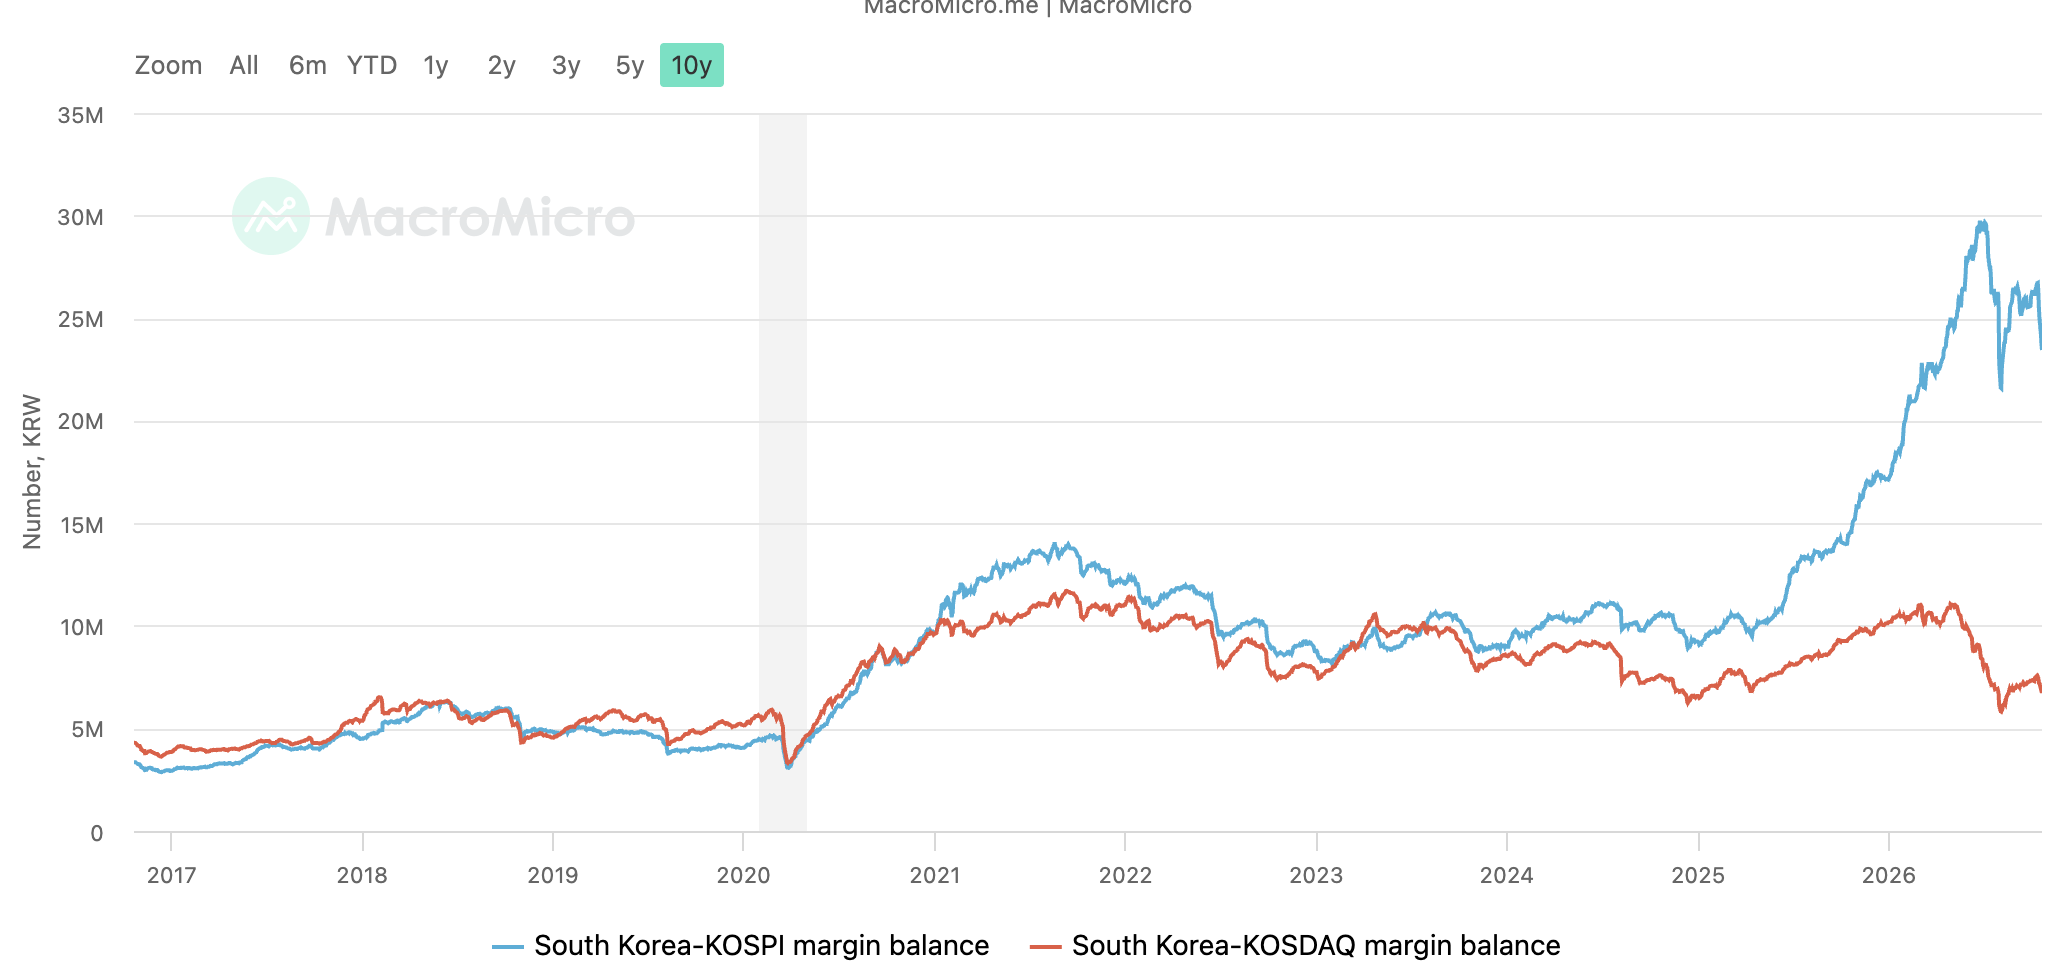
Margin debt works great in the bull market but it's painful in a bear market. In 2026, Korean retail investors aggressively borrowed funds to ride a massive tech rally. Driven by the late May regulatory introduction of single-stock leveraged ETFs and structural credit, outstanding margin loans peaked at a record 38.63 trillion won ($29 billion) on June 24. Crucially, Korean retail investors make up over 60% of all market volume, meaning an unusually high concentration of market value rested on short-term debt.
The US market by contrast, is overwhelmingly dominated by large institutional players (pension funds, hedge funds, asset managers). Although US margin debt recently reached an unprecedented all-time high of $1.502 trillion in June 2026, this leverage is spread across a massive, deeply diversified multi-trillion-dollar ecosystem. If we look at history of Margin Debt of institutions and its surge:
The Dot-Com Bubble (1999–2000): Margin debt surged 80% in 12 months as investors borrowed heavily to buy internet stocks. When the bubble burst, broker liquidations cut total margin debt nearly in half, forcing the S&P 500 down 49% and the Nasdaq down 78%.
The Great Recession (2006–2007): Leverage grew 66% in 13 months right before the subprime housing crisis hit. The subsequent forced deleveraging wiped out billions in equity, leading to a 57% drop in the S&P 500 by March 2009.
The Post-COVID Speculation (2020–2021): Fueled by low interest rates and stimulus checks, margin debt peaked right before the 2022 bear market, which dropped the S&P 500 by 25%.
The Artificial Intelligence Wave (2025–2026): Driven by intense speculation on AI infrastructure, US margin debt skyrocketed 77% over a 14-month period, climbing from under $900 billion to its June 2026 peak of $1.502 trillion
Now we need to understand what happened to Kospi and why it crashed in June. Definitely the margin debt was a problem but when BOK (Bank of Korea) increased the benchmark repo rate, South Korean securities firms automatically passed those borrowing costs down to retail accounts by raising their brokerage service fees on credit loans. The same thing is happening in the US as well but on a much larger scale.
Effects of Concentration
When comparing the market concentration of Artificial Intelligence (AI) themed stocks in the US against South Korea, we are looking at two vastly different structural profiles. While both countries have experienced heavy index distortions due to AI speculation, the US market features a multi-layered ecosystem, whereas the Korean market represents a highly exposed single-point bottleneck. Korea has a higher concentrated bet on AI in their index with 52% of the share is in AI while in the S & P 500 it's currently at 35-40%. Historically every time one sector reaches these levels.
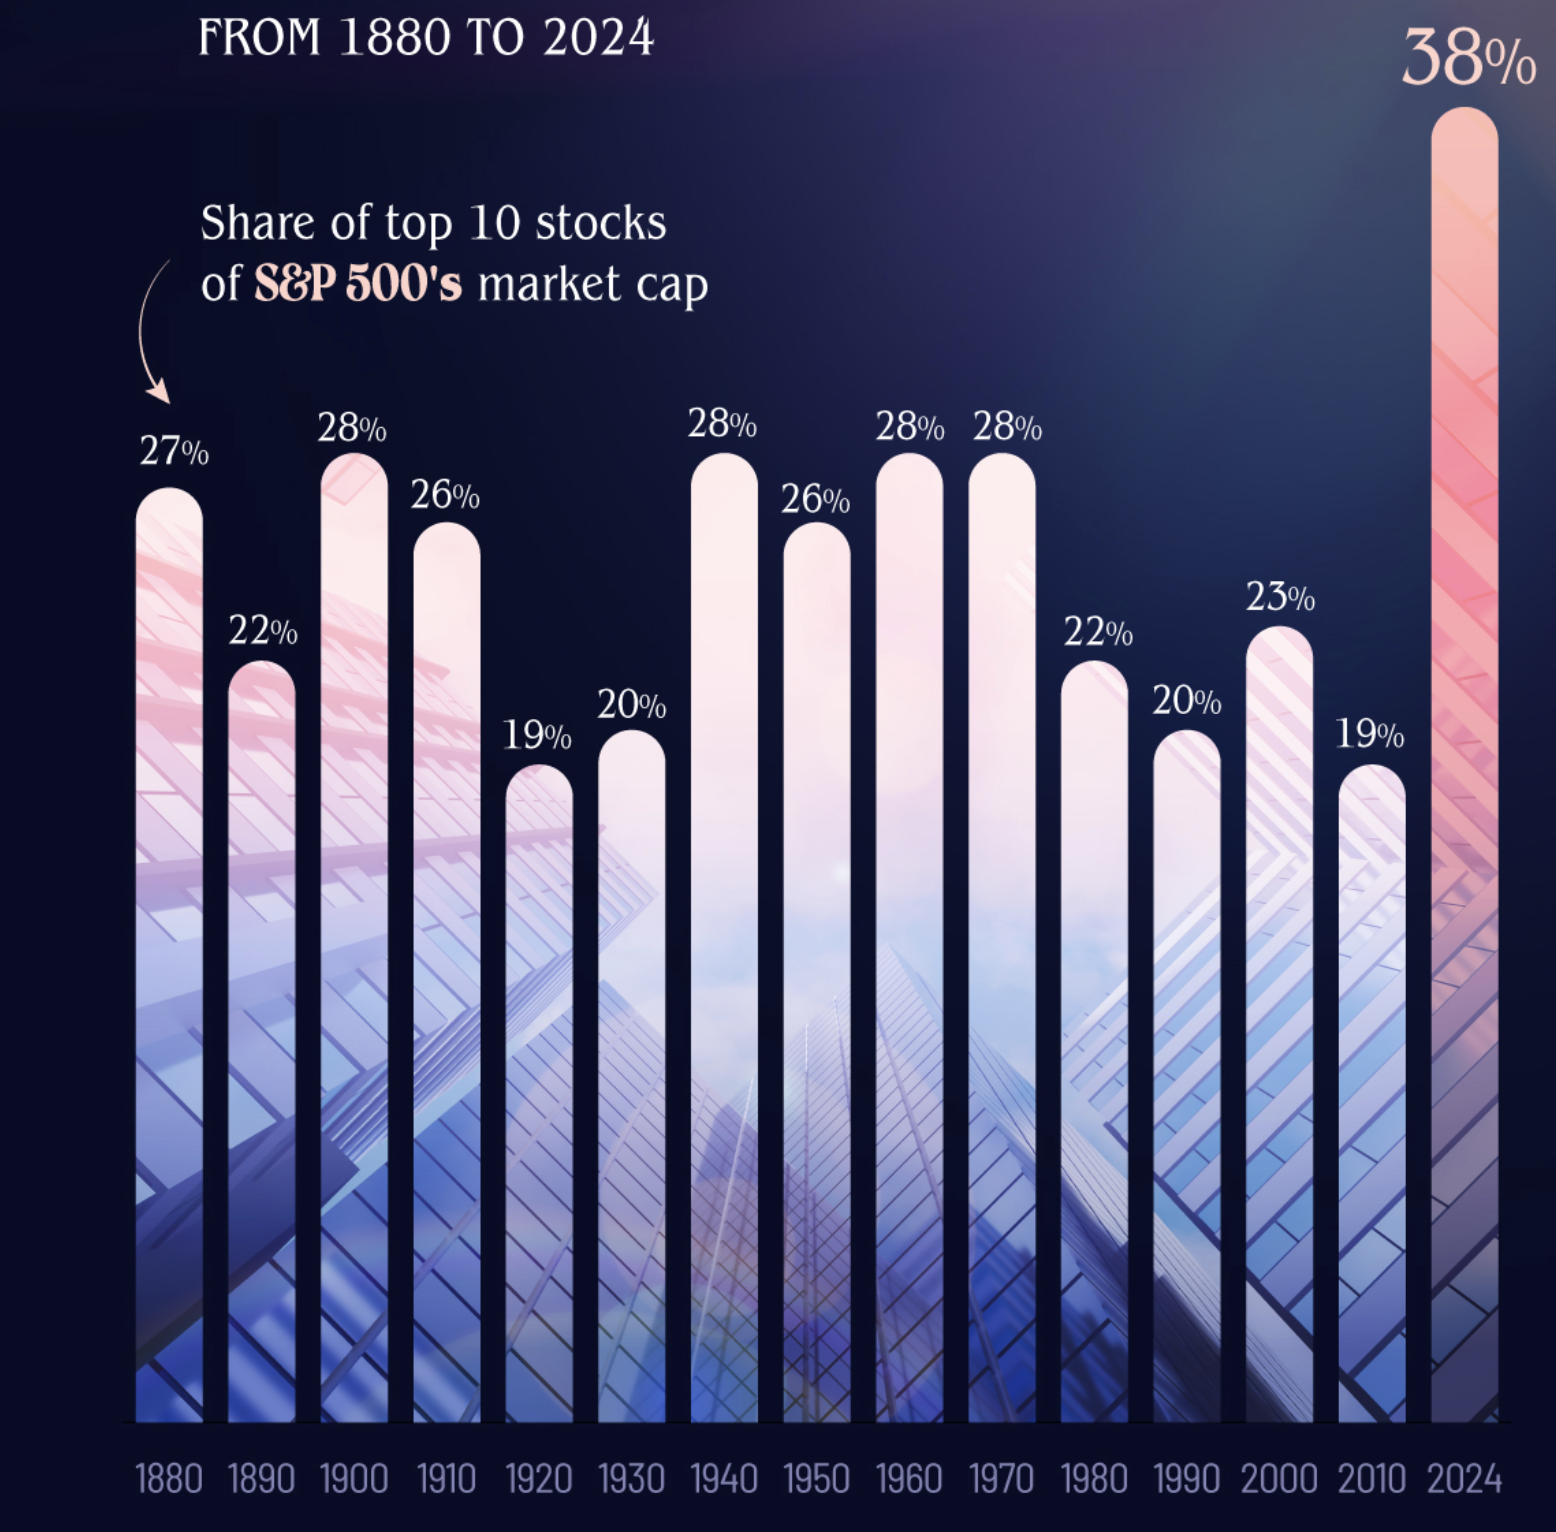
Even during the most famous speculative periods in modern economic history, such as the 1929 roar, the 1970s "Nifty Fifty" era, and the 2000 Dot-Com Bubble, market concentration never reached the levels seen today. Long-term data shows that the index's concentration crossed into the 35% to 40% range for the very first time between late 2024 and 2026, driven by mega-cap technology and Artificial Intelligence clusters.
Takeways
What should you do with this Information?
1. Pivot to Equal-Weight ETFs: Consider shifting a portion of your core equity holdings from standard S&P 500 funds into an equal-weight S&P 500 ETF. This mechanically trims your exposure to the overvalued top 10 mega-caps and distributes your money evenly across the remaining 490 companies. Or simply trim your tech exposure and go to cash.
2. Build a Dry Powder Buffer: With retail cash levels at historic lows and margin debt high, holding cash or short-term Treasury bills yielding 5% is a tactical advantage. Having cash on hand ensures you can buy high-quality companies at deep discounts if a forced margin liquidation cascade hits the US market.
3. Adopt Strict Stop-Losses on Leveraged Positions: If you hold any single-stock technology names on margin or use leveraged ETFs, implement strict trailing stop losses. As the KOSPI proved, once a forced liquidation cascade begins, brokerages sell your assets programmatically at the morning bell, completely ignoring fundamental value.